PLOTTING RANDOM PAIRS - IN SCRATCH
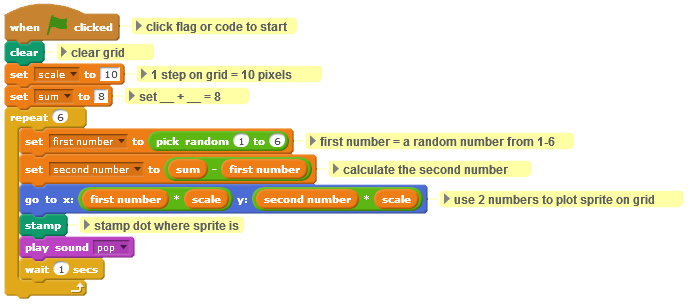
In Scratch code

  • Explore the link between coding and plotting random pairs.
  • Change the Scratch code to create your own.
  • See below for Scratch Version 1 - Graph.


Math overview

See the interview with mathematician Matheus Grasselli.

   
Version 1 - Graph  

Code - play with the Scratch code
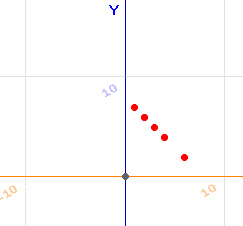
  • The Scratch code below simulates this math exploration:
    • Start with __ + __ = 8
      • Repeat 6 times:
        • Roll a number cube to get the first number
        • Calculate the second number
        • Plot the pair of numbers on the grid
        • Record the pair of numbers in the table
  • Change the values in the code and see how the graph changes.

Output

  • The graph plots six random pairs of numbers that satisfy the number sentence __ + __ = 8.
  • Why do the points line up when they are random?
  • Why do we sometimes see less than 6 points?
  • Set the sum to a different number to see effect.


See more Scratch versions

 
  • Version 2 - with both table and graph output
  • Version 3 - with random colour for points plotted
  • Version 4 - with points plotted in order (not random)